
Publishing your revenue doubles your views, and wins you almost no followers
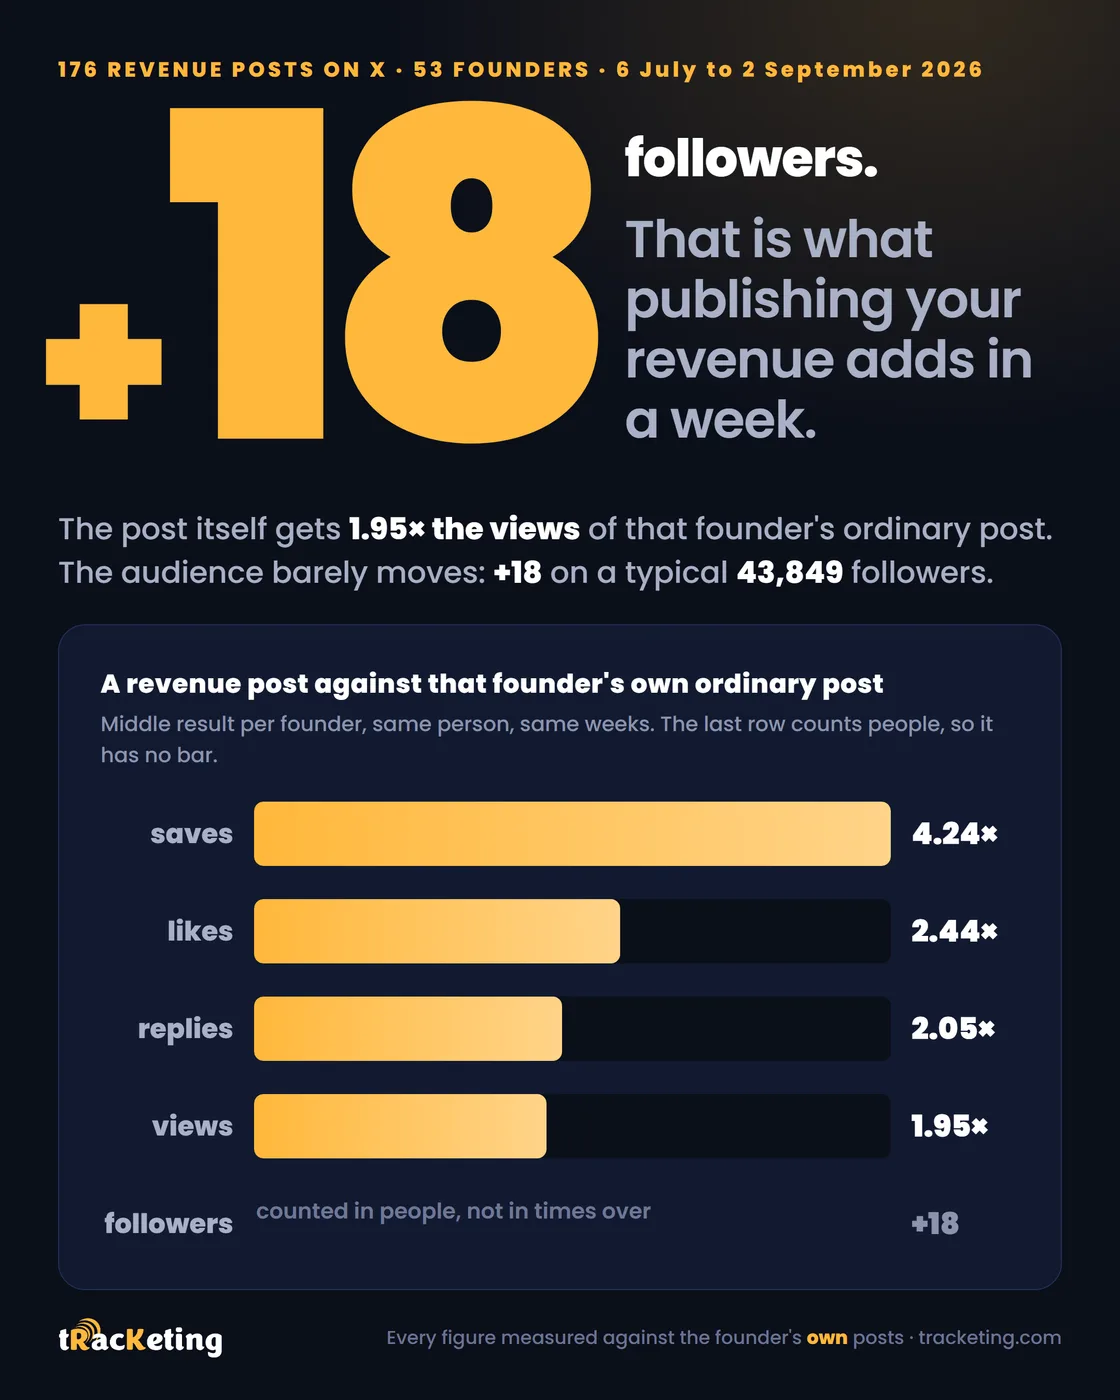
A revenue post gets 1.95× the views of that founder's own ordinary post. If it is a month-end recap, a post whose only job is to state the month and the figure, it gets 3.68×. Almost none of those extra views become followers: in the week a typical founder publishes one, they gain about 18 followers, on a following of 43,849.
what a revenue post gets
01The answer, before we show how we got it
Founders who publish what they earn are not a random group. They are having a good month, and they are mostly the bigger accounts. So every figure here compares a founder with their own other posts, never with a founder who has a bigger or smaller following. For the follower numbers we also check what everyone else we track did in the same week, so a good week for everybody does not get counted as a win for the post.
It roughly doubles the post. The typical revenue post gets 1.95× the views of that founder's own ordinary post, across 50 founders: 44 of them got more views than their usual post and 6 got fewer. It is saved 4.24× as often, which is the clearest sign on this page that people wanted to keep it: somebody who saves a post plans to come back to it.
Almost none of those extra views become followers. In the week a typical founder publishes one, they gain about 18 followers on a following of 43,849. Treat that as "no change" rather than as a small win: of the 23 founders we could measure this way, 14 gained and 9 lost, which is what tossing a coin looks like. It is the less exciting half of this finding, and it is why publishing the views figure on its own would give the wrong impression.
6 July to 2 September 2026 · X · 176 revenue posts from 53 founders
02How you write it matters more than the number itself
The same number, published two ways, is worth two very different amounts. A dated month-end recap is a post a reader recognises and expects: it arrives at the end of the month, it says the month, and it says the figure.
A dated month-end recap gets 3.68× the views of that founder's own ordinary post, measured on 19 recaps. The same figure written into a post about something else is worth 1.58×, on 154 posts. Both beat an ordinary post, and a recap is worth more than twice what the same figure is worth inside another post.
So the decision is not whether to publish the number. It is whether to give the number its own post at the end of the month, instead of writing it into a post about something else.
Each post is compared with its own author's ordinary post, then we take the middle of each group. A founder who published four recaps therefore counts four times here, unlike the headline figure, which counts each founder once.
6 July to 2 September 2026 · 19 dated recaps and 154 other revenue posts
Swipe the chart sideways to see all of it →
03The dated recaps we could measure, one by one
A middle figure taken from 19 posts can hide one very large post that lifted it. It does not here. Below is every dated recap we could measure against its own author's ordinary post, each one shown on its own.
All 19 of the 19 beat their own author's ordinary post. Not most of them. All of them. That is the strongest single result on this page, and it is why the recap gets a section of its own rather than a line in a table.
Even the lowest one beat its author's ordinary post. It is not a big-account effect either: the three recaps that did best belong to founders whose ordinary post gets about a thousand views, not to the largest accounts we track.
One row per recap, so a founder who published two appears twice. Each is measured against everything else that founder published across the whole eight weeks, which is a different comparison from the one used in the two-month table further down.
6 July to 2 September 2026 · X · 19 dated recaps
Swipe the chart sideways to see all of it →
04What the post itself gets
Four things a post can earn, each one compared with what that same founder usually gets. The bars are measured from 1, which is that founder's ordinary post, so a bar of any length at all means the revenue post did better.
Views are the number people quote, at 1.95×. The biggest multiple on the chart is saves, at 4.24×: for 19 of the 20 founders we could measure, the revenue post was saved more often than their usual post.
Reposts are left out. We could only measure them on four founders. A figure from four people looks just as solid as a figure from fifty. It is not.
One founder at a time, then the middle founder of those. A founder counts only where their ordinary post already gets at least three of whatever is being counted, so a founder whose usual post gets one save cannot turn a single extra save into a huge multiple.
6 July to 2 September 2026 · X · between 20 and 50 founders per row
Swipe the chart sideways to see all of it →
05The recap is the one people answer
The same measures, split by how the post was written, separate the three even further. The chart below uses three groups, not two: a dated month-end recap is a post whose only job is to state the month and the figure; a milestone is a round number announced when it is reached, such as crossing $10,000; a passing mention is the figure written into a post about something else. The two ways shown earlier on this page were the recap against the other two counted together.
Likes are the best measured of the three. A recap draws 5.19× the likes its author normally gets, against 2.13× for a milestone and 1.77× for a passing mention, and 16 of the 17 recaps we could measure were liked more than usual. Replies follow the same shape.
Saves are higher for the recap too, and the saves bar is the one to read with care. Three of these founders have an ordinary post that gets a single save, so an ordinary result turns into a huge multiple. The 8.15× drawn here already leaves those founders out: it counts only the 7 founders whose ordinary post gets three saves or more, and 7 of those 7 saved the recap more than usual. Treat the likes figure as the measurement and the saves as the direction.
Every bar needs the founder's ordinary post to already draw at least three of whatever is being counted. Without that floor, a founder whose usual post gets one save turns an ordinary result into a hundredfold one.
6 July to 2 September 2026 · X · 19 recaps against 154 other revenue posts
Swipe the chart sideways to see all of it →
06It will not be your best post of the month
A recap beats your typical post almost every time. It also loses to your best post almost every time. Both are true, and the second of those is the one nobody expects.
Set each recap against the single best-performing ordinary post the same founder published in the eight weeks, and the recap won 1 time out of 19.
Ranked by views, the typical recap comes 11th out of the roughly 161 posts its author published in those eight weeks, and 5 of 19 were in their author's best three.
Coming 11th out of 161 is a good result for ten minutes of writing once a month. It is still not the biggest thing you will publish, so do not expect it to be.
A bar past the 1 line means the recap got more views than the best thing that founder published in the whole eight weeks. Short of it means something else of theirs did better.
6 July to 2 September 2026 · X · 19 dated recaps
Swipe the chart sideways to see all of it →
07And almost none of those views turn into a follower
Below are the 51 revenue posts where we have a follower count before and after, put into four groups by how many views each one got against what that founder normally gets. The groups run in the same order as the chart.
The follower gain does not rise with the views. A post that got fewer views than usual won a typical 74 followers, one that got up to twice its usual views won 6, and one that got two to five times won 9. Going further did not win more. Across all four groups, 34 of the 51 posts gained followers that week and 17 lost some.
The one group that is different is the last. 8 posts got more than five times their usual views; the typical one of those gained 332 followers and all 8 gained some. That is only 8 posts, so treat it as a sign rather than a rule.
Read the first bar carefully. Those 11 posts run from losing 576 followers to gaining 1,643, so its middle is not a number you can rely on. It is on the chart because leaving it off made the other three look like a steady rise, and they are not one.
So publishing your revenue is not a way to grow. It is a way to be seen, and sometimes a post gets far more views than usual and brings followers too.
The first group did worse than usual and still won followers, which is the point: across the first three groups the follower count does not rise with the views. Its own posts run from losing 576 to gaining 1,643, so read it as "no clear answer" rather than as a result.
6 July to 2 September 2026 · X · 51 revenue posts from 21 founders with follower counts either side
Swipe the chart sideways to see all of it →
08Compared with an ordinary post that got just as many views
The chart above says a revenue post that gets a lot of views brings followers. On its own that is not a finding about revenue posts. Any post that gets a lot of views brings followers, so the question is whether a revenue post brings more of them than an ordinary post that did equally well.
So we did the same to every other post those founders published: 10,904 posts from 223 founders, put into the same four groups by how many views each one got against that founder's usual post.
In the top group the answer is clearly yes. A revenue post that got more than five times its usual views was worth a typical 332 extra followers. The 704 other posts that got just as many views were worth 26. So in that group a revenue post was worth about 13 times as many followers as an ordinary post that did equally well.
Treat the size of that gap as a direction rather than a measurement: it comes from only 8 revenue posts. In the middle two groups a revenue post and an ordinary post are worth about the same. The first group is the one described above, whose middle nobody should rely on.
The middle post in each group, measured against that same founder's ordinary week. The pale bars are every post in the window that is not a revenue post, put into the same groups and counted exactly the same way.
6 July to 2 September 2026 · X · 51 revenue posts against 10,904 other posts
Swipe the chart sideways to see all of it →
09The biggest of those 8 posts, day by day
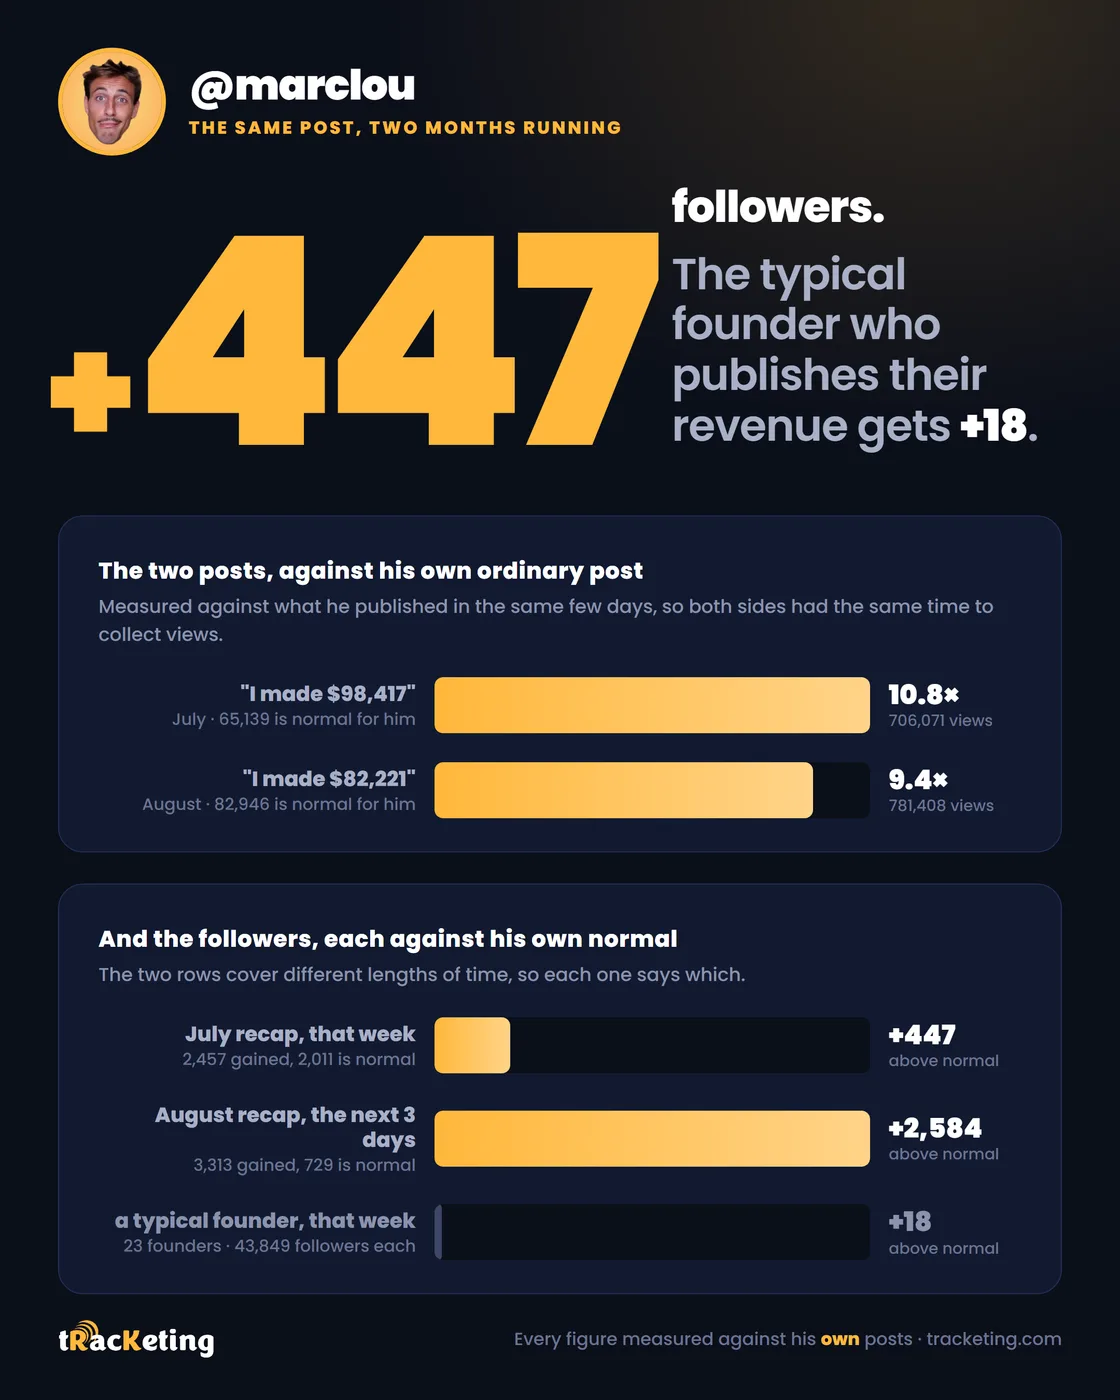
Of the 51 revenue posts we can follow on followers, the one that got the most extra views is @marclou's month-end recap on 31 July: 706,071 views, against an ordinary post of 63,876 measured across the whole eight weeks. The picture in the next section compares the same post with the same few days instead, which is why it says 65,139 there. His follower count is checked every day rather than once a week, so this one week can be shown day by day instead of worked out afterwards.
Read the seven days after the recap rather than the day itself. The day he posted added only 101 followers, well under his ordinary day of about 287; the week that follows adds 2,457 against an ordinary week of 2,011. That is 447 extra people out of 642,196 extra views, and it is why the tallest point on the chart is a week after the post rather than on it.
That is the most extra views any post we can follow brought in, and both numbers matter. It is a very large post by any measure. Fewer than one viewer in a thousand went on to follow him.
The daily change in @marclou's follower count. The recap went out on 31 July, and the seven days the text counts are the ones after it. The line starts a day after the first reading, because a change needs two readings. There is no reading for 6 August, so the point on 7 August carries two days of growth and is taller than any single day was.
21 July to 12 August 2026 · X · one founder, counted daily
Swipe the chart sideways to see all of it →
10The same founders published again the following month
A format that works once at the end of a month might just be one good month. The window holds two month ends, so it can be checked.
7 founders published a dated recap in both months. Every one of them beat their own ordinary post both times, from 1.37× to 17.49× in the second month. The format works again. That is the single most useful line on this page, because a result that happens twice is one you can rely on.
The multiples in the table below are not the same as the ones in the chart further up. Some are bigger and some are smaller, because the two are measuring different things. The chart compares each recap with everything that founder published across all eight weeks. The table compares it with what they published in the same few days, which follows an account that is growing month by month instead of averaging over it.
What cannot be said is whether the habit is spreading. We hold recaps from 11 founders in the first month and 8 in the second, and that difference is ours, not theirs: we collected posts from most of the founders we track on 30 August and from only a fraction of them on the 31st, which is the day the recaps land. Every founder in that table was collected on both dates, which is why we can compare those seven fairly, but cannot say how many founders did it.
6 July to 2 September 2026 · X · one founder counted daily, against 23 founders counted weekly
| founder | first month | second month |
|---|---|---|
| @martindonadieu | 11.82× | 17.49× |
| @tech_nurgaliyev | 42.70× | 12.00× |
| @marclou | 10.84× | 9.42× |
| @s_chiriac | 15.16× | 5.44× |
| @wickedguro | 2.53× | 2.86× |
| @mustafaergisi | 6.95× | 2.84× |
| @brian_millot | 1.69× | 1.37× |
Each recap against what that same founder published in the same few days. Both columns are the same measurement, one month apart.
11We finally have a before and after for the recap
Three earlier versions of this study said the follower effect of a month-end recap could not be measured. The reason turned out to be our own timetable rather than bad luck, and it would have happened again every month: follower counts are checked once a week on a Monday, and the last day of August 2026 was a Monday. The check fell on the same day as the recap and the next one was not due for another week, so there was nothing to compare a recap with.
So an extra count was taken three days later. That gives a reading on the day of the recap and another three days on, for everybody: 137 founders have a real reading on both dates, 7 of whom published a recap.
The founders who published one added a typical 62 followers in those three days, on an audience of about 11,675. Founders of the same size who published no recap added about 6. The chart shows the same thing as a share of each founder's own audience, which is how founders of different sizes can be put on one picture.
7 founders is a small number, so read this as a direction and not yet as a figure you can rely on. It is a direction we will be able to check every month from now on: a follower count of every founder we track runs on the 3rd, two or three days after every month-end recap, so next month the same comparison can simply be made instead of having to be pieced together afterwards.
Each founder who published a recap, beside founders of their own size who did not. One founder on each dark bar, so read the shape rather than any single pair. The typical figure quoted above is the middle of all 7 of them, including the one who added nobody. Separately, 4 of the 7 have enough of their own history to be compared with themselves, and all of those beat their own ordinary three days.
31 August to 3 September 2026 · X · 137 founders with a real reading on both dates
Swipe the chart sideways to see all of it →
12The more you earn, the more likely you are to say so
Only 10.5% of the founders who post on X have ever published a revenue figure: 53 of 504. Who they are matters, because it is the reason every figure above compares a founder with their own posts.
Group all the founders we track by what they earn, and the higher the earnings, the more of them have published a figure. Among founders earning under $10,000 a month, 11.2% have published one. Among those earning over $100,000 a month it is 21.7%, about twice the share. The first bar is not an earnings group at all: it is the founders we have never been given an earnings figure for, and fewer of them publish one than any other group.
That is not advice to earn more before you post. It is the warning that goes with every number on this page: the founders who do this are not typical founders, and we cannot separate the effect of publishing from the effect of having a good month.
Grouped by what we hold on record for the founder, not by the figure in the post, so which group a founder sits in does not depend on whether they posted.
6 July to 2 September 2026 · 504 founders we track, 53 of whom have published a figure
Swipe the chart sideways to see all of it →
13This is an X habit, and it barely exists anywhere else
Of the 245 revenue posts we kept across every platform we track, 176 are on X. LinkedIn has far fewer, and every other platform has almost none.
Almost nobody puts the same figure on two platforms either. Only 8 founders ever put the same figure in more than one place on the same day, on 14 of the 224 times a founder published a number at all. One founder publishing on one day counts as one of those times, so it is a larger count than the number of posts.
That is why the rest of this page is measured on X. It is not a choice about which platform to feature. It is where the thing being studied happens.
Posts read one by one and confirmed as a founder stating their own revenue, counted by the platform they were published on.
6 July to 2 September 2026 · every platform we track · 245 posts
Swipe the chart sideways to see all of it →
14Nothing happens on the platforms that never saw the post
This is the test that separates "the post did it" from "these people were growing anyway". In the weeks a founder published a revenue figure somewhere, we measured their following on the platforms that never carried it. If the growth were really about the founder having a good month, it would show up everywhere.
Nothing of any size moves. The largest is Instagram at 0.06% of the audience across 23 founders. On an account with 40,000 followers that is about 23 people in a week, and 14 of those 23 founders grew faster than usual while 9 grew slower, which is the split you get from chance.
Whatever publishing your revenue does, it does it where the post was published. That is good news for the view figures and bad news for the follower ones: publishing your revenue really does something, it only does it where you published it, and what it does is small.
The difference between the weeks a founder published a revenue figure elsewhere and that same founder's ordinary weeks, taken one platform at a time.
6 July to 2 September 2026 · every platform we track · founder counts differ per row
Swipe the chart sideways to see all of it →
15A bad month does as well as a good one
Not all of these posts are good news. Some are a month of cancellations, a product at zero, a month that went nowhere. Whether being honest costs anything is worth checking, because the fear that it does is what stops people publishing at all.
It does not. A post written as a bad month gets 1.81× the views of its author's ordinary post, on 19 posts from 12 founders. A post written as a good month gets 1.70×. The biggest group of all is the posts that simply state the number and add nothing, and those get 1.88×, on 115 posts.
Those groups are too small to call a finding and we are not calling it one. What can be said is that nothing in the numbers suggests publishing a bad month is punished, which is the thing people actually worry about.
Grouped by the words in the post rather than by the amount: a founder on $500 can be delighted and one on $30,000 can be reporting a collapse.
6 July to 2 September 2026 · X · 3 groups of 19 to 115 posts. A fourth group of 5 is too small to draw
Swipe the chart sideways to see all of it →
16Does it wear off if you do it every month?
That is a fair worry, and the two honest ways of counting give different answers. Both are below, because the difference between them is the thing to understand.
Count every founder's posts together and a founder's first revenue post in the window is worth 1.60× and their fourth or later is worth 1.69×, which looks like no drop at all.
Compare each founder with themselves instead, inside the 17 founders who published four or more times, and 9 went down while 8 did not. That is an even split. The first way of counting gives the better flattering number and the second gives the honest one, and the honest one is that we cannot tell.
| which post it was for that founder | posts | times their ordinary post |
|---|---|---|
| their 1st in the window | 50 | 1.60× |
| their 2nd or 3rd | 50 | 2.02× |
| their 4th or later | 73 | 1.69× |
Every founder's posts counted together. The comparison of each founder with themselves, described above, is the one to trust, and it cannot tell either way.
17What founders say they earn is not what we hold on record
10 of the founders who published a dated figure are also on our own records with a revenue figure from an independent source. 8 of the 10 published a bigger number than the one we hold.
The largest gap is @indexsy, who published $296,237 against $102,701 on record.
This says more about our record than about the founders. The figure we hold is the highest one a public directory ever listed for them, and nothing updates it, so any founder who has grown since will look like they are exaggerating. It is also why this page never uses the figure in the post to measure anything.
One row per founder who published a dated revenue figure and for whom we also hold an independently sourced figure.
6 July to 2 September 2026 · X · 10 founders
Swipe the chart sideways to see all of it →
18What to do with this
Give the number its own post at the end of the month. That one choice is worth 3.68× against 1.58× for the same fact. It is the largest difference on this page that you can control by how you write the post, and it costs nothing.
Expect attention, not followers. The typical revenue post is saved 4.24× as often as an ordinary one and brings about 18 extra followers that week. Judge it as something people want to keep, because that is what they do with it.
Do not expect it to be your best post of the month. Against the best ordinary post the same founder published in eight weeks, the recap won 1 time out of 19.
Put it on X. 176 of the 245 revenue posts we found are there, and nothing measurable happens to a following on a platform that never carried the post.
Publish the bad months too. They get as many views as the good ones, and nothing here suggests saying so costs anything.
How this was measured
We looked at posts published from 6 July to 2 September 2026. 448 posts carrying a money figure were read one by one: 245 were revenue posts and 203 were not. 176 of the ones we kept were posted on X, and those are the posts every figure above is measured on.
Every figure compares a founder with their own other posts published in the same eight weeks, never with another founder. A founder is included only where they have at least three ordinary posts to compare against, so the post we measure against is never a single lucky one.
The post figures and the follower figures are both X. Follower counts are checked once a week, and what the rest of the founders we track did in the same week is taken off, so a good week for everybody cannot look like the post working.
Two different comparisons appear on this page and it is worth knowing which is which. Most of it compares a post with everything else that founder published across the whole eight weeks. The two-month table and the picture beside it compare a recap with what that founder published in the same few days. The two give different numbers for the same post, sometimes higher and sometimes lower, and where both appear the page says which is which.
What this cannot tell you
A founder who publishes their revenue is having a good month, and is usually one of the bigger accounts. Comparing them with their own posts removes the size problem. It cannot remove the good month.
X only. LinkedIn does not publish a view count we can read for these founders, so there is no second platform to check the post figures against.
Whether the size of the figure matters. Sorted into four groups by the amount published, the views multiple runs 1.29× for under $1,000 a month, 1.94× for $1,000 to $10,000, 1.07× for $10,000 to $100,000, 2.36× for over $100,000. There is no pattern in that, on 166 posts. Either the amount does not matter, or we do not yet have enough posts to see it. You can get the full figures with the button below.
What a revenue post is worth to the business, in signups or sales. We can see the post and the following. We cannot see the money.
19What counts as publishing your revenue, and the 203 posts we removed
Nearly half of what looked like a revenue post was not one. Of the 448 posts that mentioned a money figure, 203 were removed once somebody read them, so this could not have been done by searching for words.
What came out: somebody else's revenue, a goal rather than a result, a price, a funding round, a giveaway, and a figure that did not say what length of time it covered. What stayed: a founder stating what their own product earned, over a stated length of time.
Questions
Ask about anything on this page. Questions and answers are public, and every answer is drawn from the numbers above, and where they cannot answer, it says so.
More from this board
Every number on this page comes from tracKeting, founders board, 176 revenue posts on X from 53 founders, 6 July to 2 September 2026. Anything you ask about this page is answered from the numbers on it, and where they cannot answer, you will be told.
Want to ask questions about this? This insight's id is
tracKeting tracks what founders, AI brands and Geneva estate agencies publish, and what it earns them. See what a board costs.